
Datascoops helps its clients gain views of their organization that have never before been possible.
By unlocking the full potential of the most complex types of data, change happens.
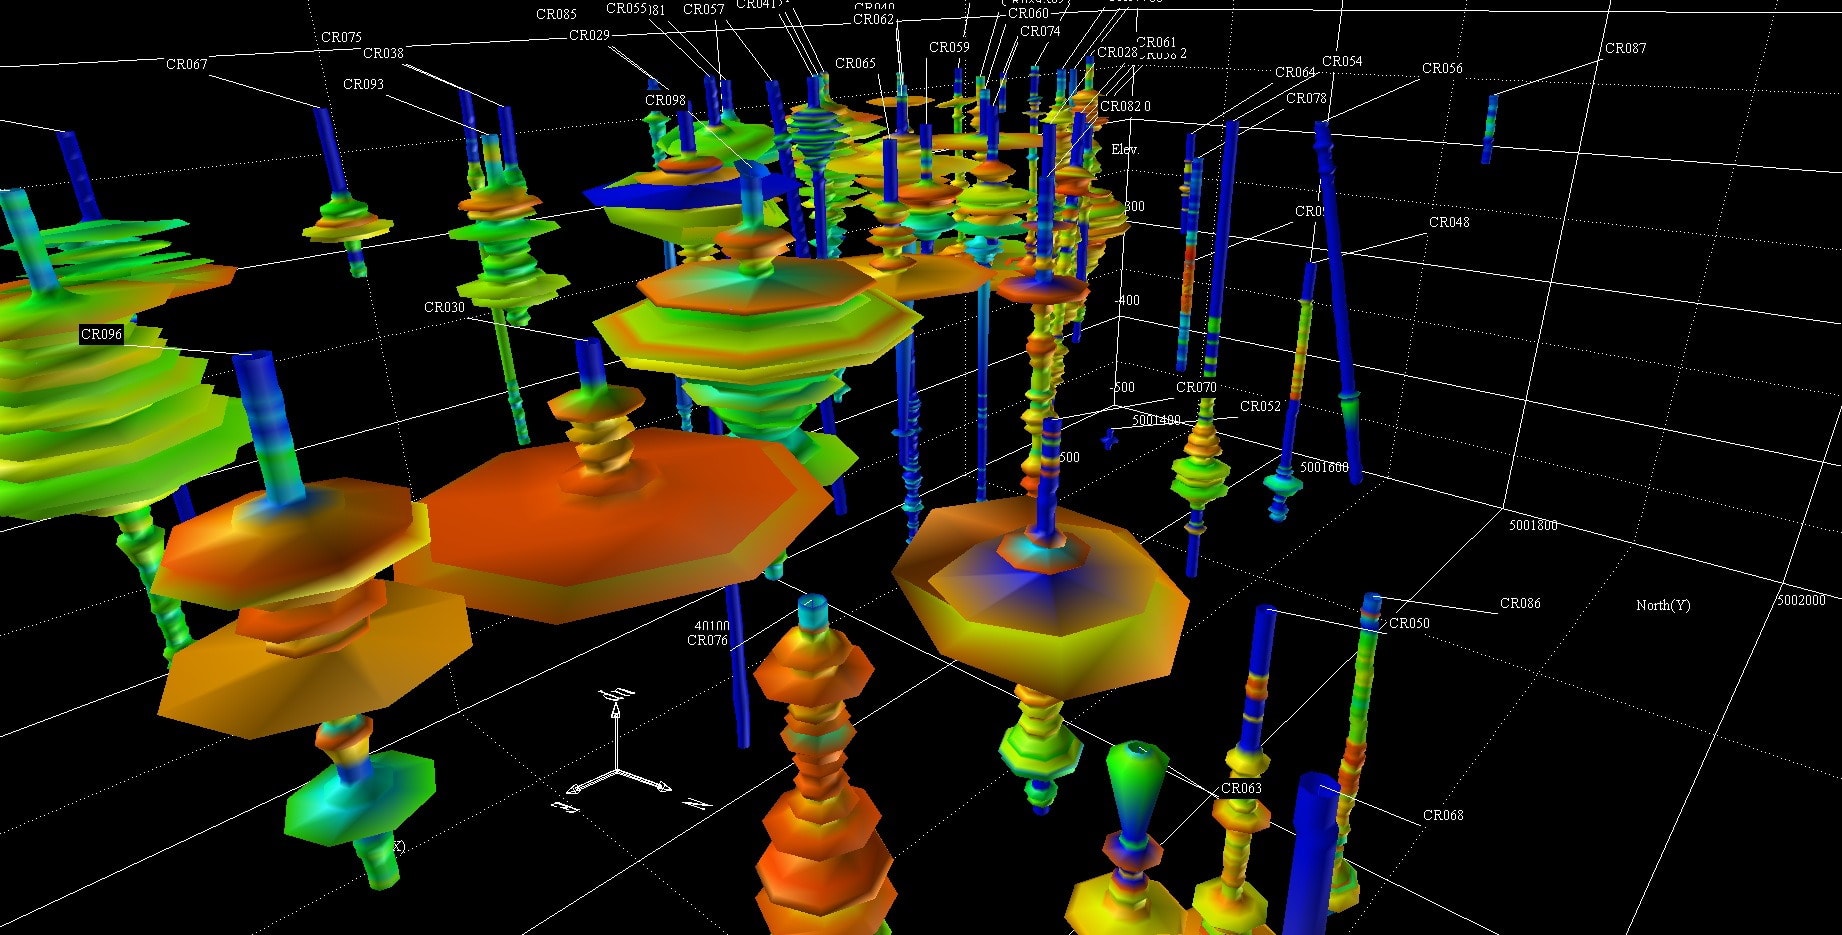
The chart was created using AVS/Express and explores 8 dimensions of big data.
Whether you are mining for crude oil, customers, criminals or a cure, Datascoops offers the tools and talent to deliver rapid insight using extreme analytics and sophisticated graphics.
Our AVS division is a pioneer and innovator of advanced data visualization used by leading corporations, governments and universities.
What type of data do you work with?

Our software has the ability to analyze and graphically depict billions of data points, transactions, customers or events.
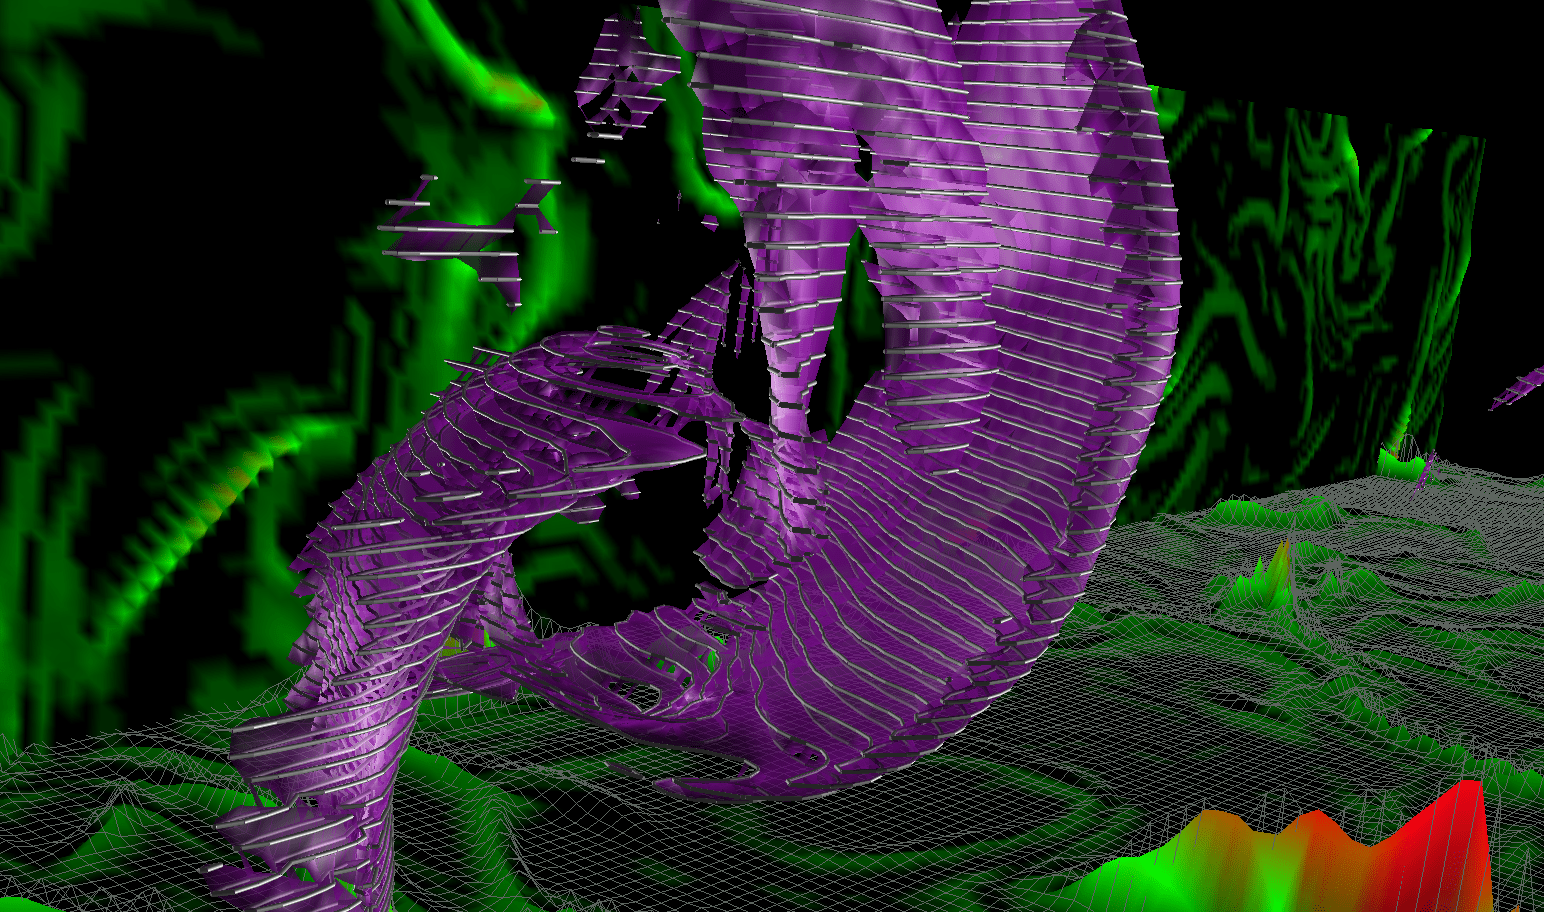
This 3D visualization of vapor passing through a cylinder isn’t too different from credit card approvals moving through a retail network or packages flowing through a transportation system.
The color, speed and variation of pattern produces insight that is impossible to capture in conventional charting and indispensable in fine-tuning performance—which is what Datascoops does.